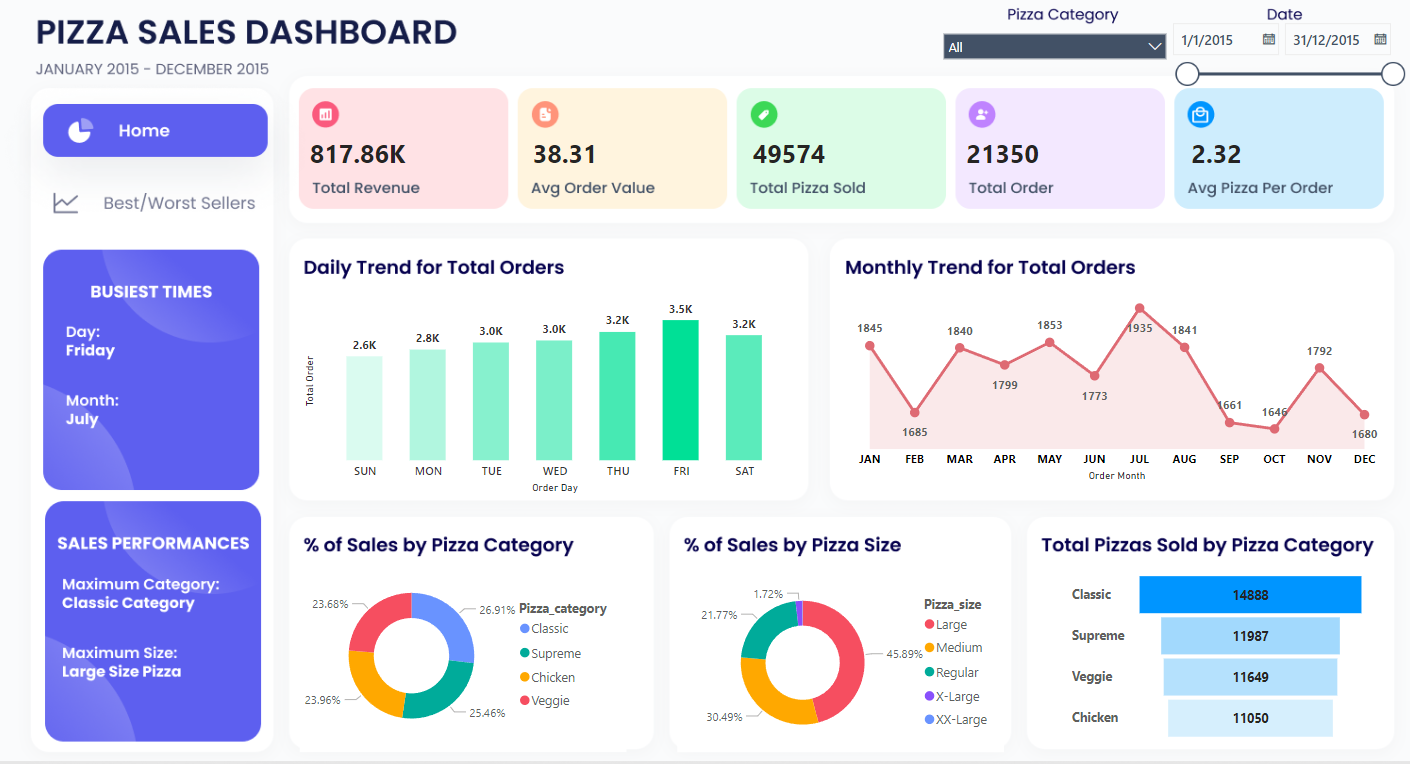
Project information
- Category: Dashboard
- Software: Microsoft Power BI
- Project date: July, 2023
PIZZA SALES REPORT DASHBOARD
🎯 ABOUT DATASET: Pizza Sales Report helps us with interpreting organizational data. It finds the pizza sales trends in the data and allows the owner to take the appropriate steps to keep the sales running smoothly and profitably. This dataset includes 48620 columns which include pizza size, pizza category, pizza price etc.
🎯 STEPS FOLLOWED FOR CREATING THIS DASHBOARD:
🎯 DATA CLEANING AND PROCESSING: • Instead of loading the data to power bi, transform data which takes us into another window which is known as POWER QUERY. It is used to clean and transform the data.


