PROJECT MANAGEMENT DASHBOARD
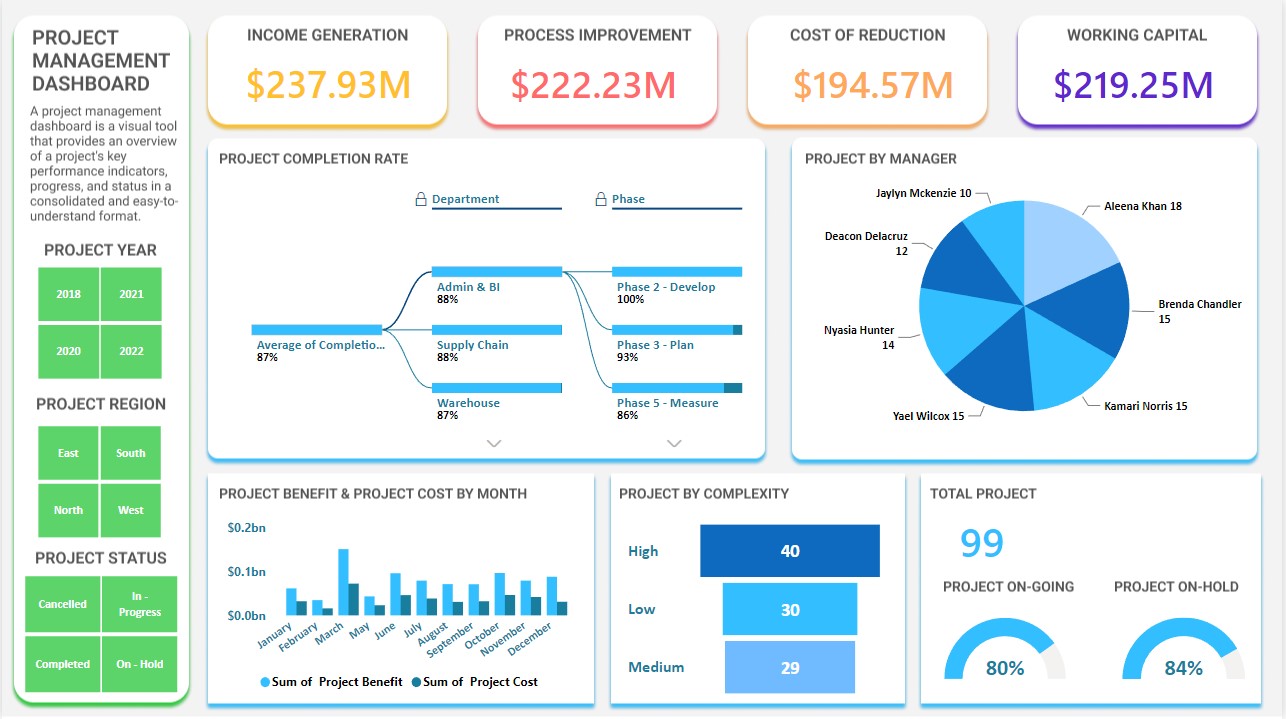
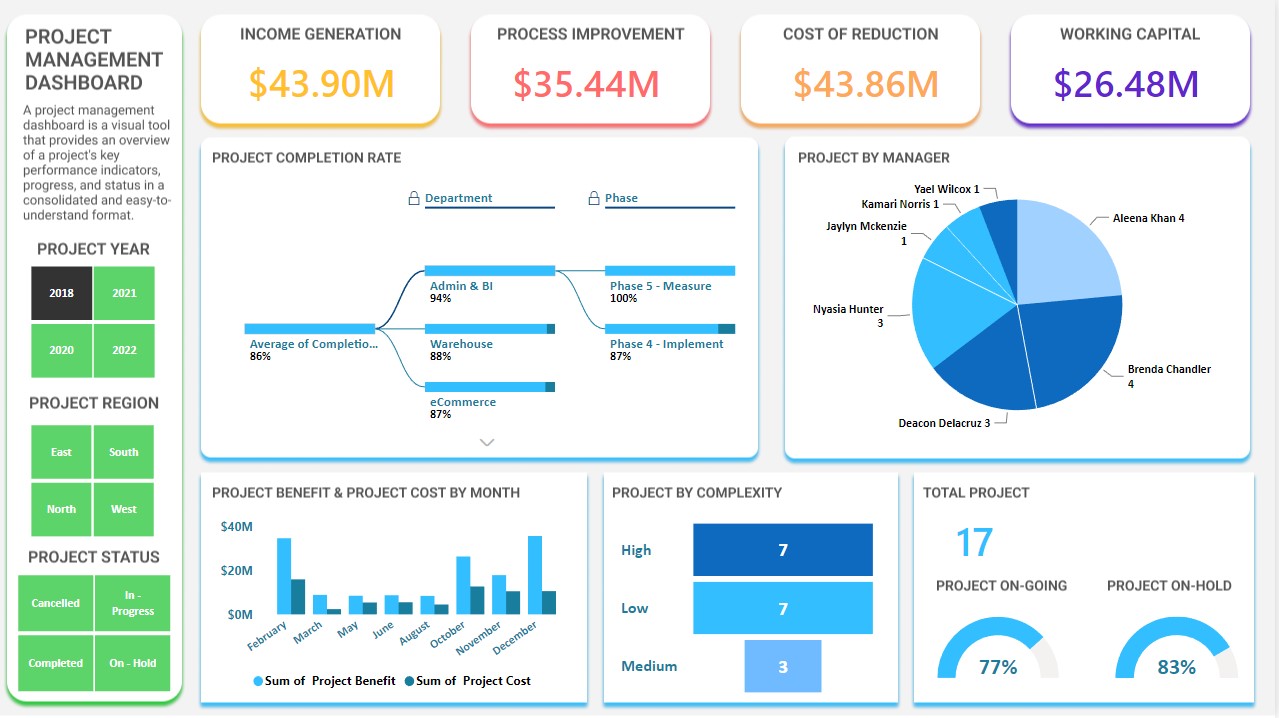
Track the success of the projects with these key performance indicators (KPIs) and insightful metrics:
💰 Income Generation: Monitor the revenue projects to ensure financial growth and sustainability.
🔄 Process Improvement: Measure the effectiveness of process enhancements in the projects, ensuring efficiency and quality.
💲 Cost Reduction: Keep an eye on the cost-saving measures implemented in the projects, contributing to overall profitability.
💼 Working Capital: Track the changes in working capital influenced by the projects, maintaining liquidity and operational stability.
Project Completion Rate:
By Department and Phase: Evaluate completion rates across different departments and project phases to identify bottlenecks and optimize workflows.
Project by Manager: Gain insights into individual managers' project completion rates, enabling targeted support and recognition.
Monthly Metrics:
Project Benefits and Costs: Visualize the monthly benefits and costs of projects to make informed decisions and assess project value.
Project Complexity: Analyze projects by complexity level to allocate resources effectively and manage expectations.
Slices and Segmentation:
Project Year: Compare project performance year by year to identify trends and areas for improvement.
Project Region: Explore how projects perform in different regions, helping with resource allocation and regional strategy.
Project Status: Get an overview of project statuses, keeping stakeholders informed and allowing prompt action when needed.


