HR Analytics Dashboard
📌 Project Overview:
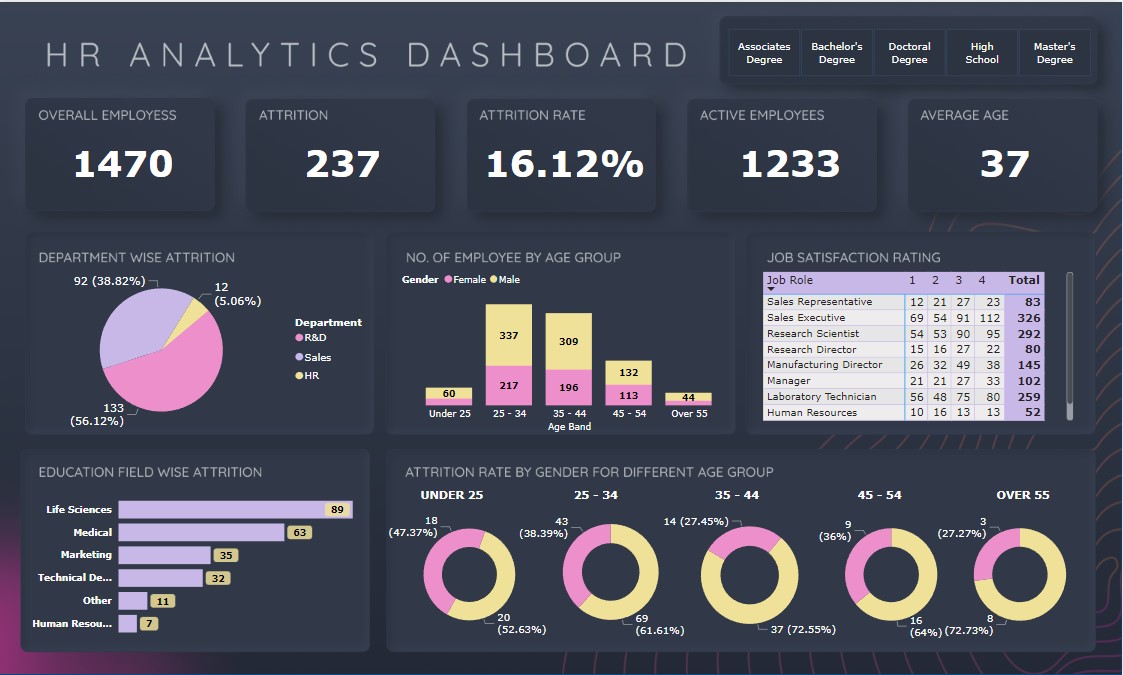
The goal of this project was to analyze HR data and answer key questions related to employee attrition and factors influencing it. By understanding the data-driven insights, we aimed to assist the organization in making data-backed decisions to enhance their workforce management strategies.
📌 Analysis Structure:
To achieve valuable insights, I considered crucial questions during the data analysis process, such as the total number of employees, attrition rate, average age, average salary, and more. By delving deeper, we explored how factors like gender, education, age group, job role, and salary slab impact attrition.
📌 Steps Applied:
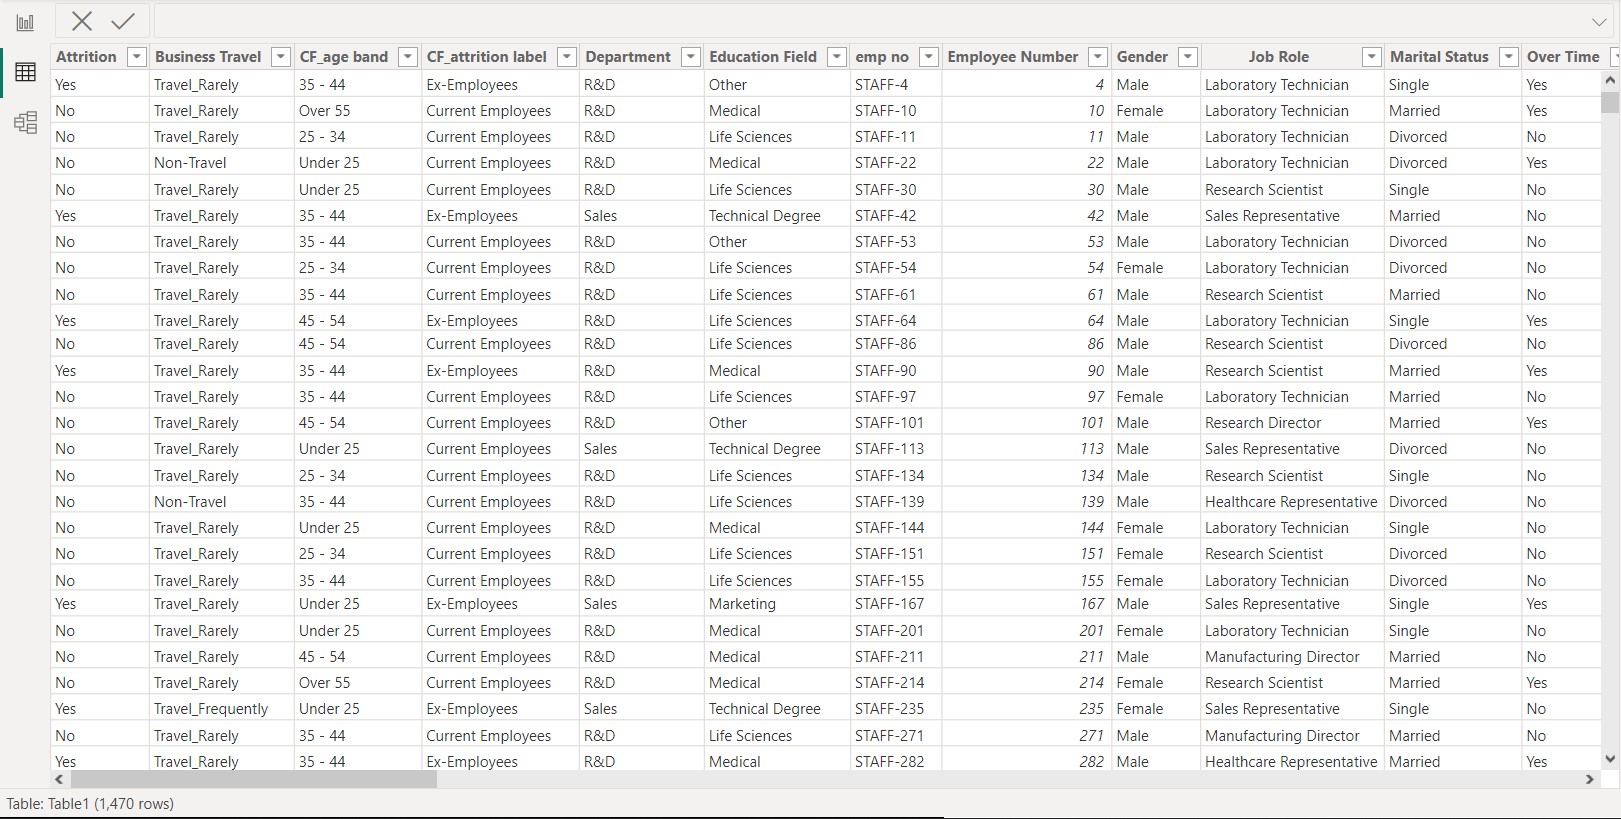
The project involved various crucial steps, including data understanding, cleaning, processing, and analysis. I leveraged Power BI's dynamic visualizations like Donut charts to present the data effectively.
🎛️ Filters:
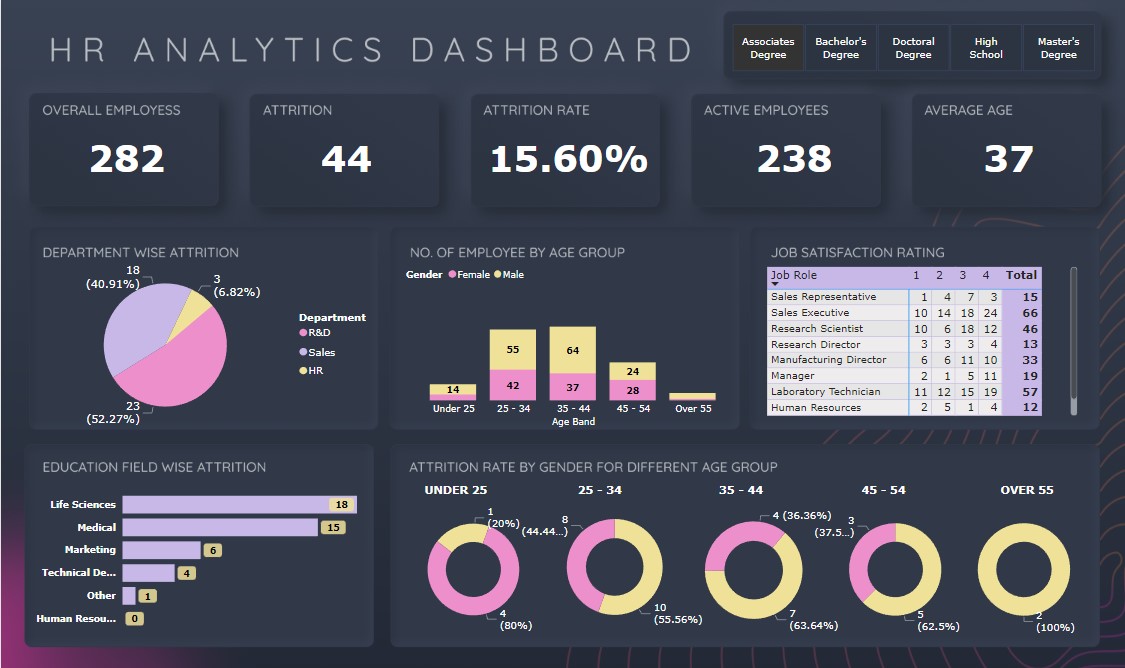
The dashboard features filters based on departments, enabling users to explore and discover deeper insights based on specific criteria.
🔎 Key Insights:
The HR Analytics Dashboard revealed some eye-opening insights:
1️⃣ Laboratory technicians experience the highest attrition rate.
2️⃣ Male employees are more likely to leave their jobs.
3️⃣ Employees in the lowest salary slab show the highest attrition.
4️⃣ A significant number of employees leave after one year of employment.
5️⃣ The age group of 25-34 is more prone to attrition.
✅🔍 Final Conclusion:
Based on the insights gained, it is recommended to focus on addressing attrition issues among laboratory technicians, male employees, and those in the lowest salary slab. Implementing strategies to improve job satisfaction, career growth opportunities, and benefits can help reduce attrition. Additionally, special attention should be given to employees in the age group of 25-34.


